2015-08-21
 537
537The Jablonski diagram that drawn below is a partial energy diagram that represents the energy of photoluminescent molecule in its different energy states. The lowest and darkest horizontal line represents the ground-state electronic energy of the molecule which is the singlet state labeled as So. At room temperature, majority of the molecules in a solution are in this state.
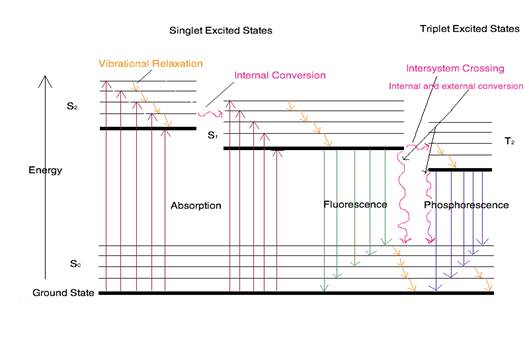
Figure 2. Partial Jablonski Diagram for Absorption, Fluorescence, and Phosphorescence
The upper lines represent the energy state of the three excited electronic states: S1and S2represent the electronic singlet state (left) and T1 represents the first electronic triplet state (right). The upper darkest line represents the ground vibrational state of the three excited electronic state.The energy of the triplet state is lower than the energy of the corresponding singlet state.
There are numerous vibrational levels that can be associated with each electronic state as denoted by the thinner lines. Absorption transitions (red lines in Figure 2) can occur from the ground singlet electronic state (So) to various vibrational levels in the singlet excited vibrational states. It is unlikely that a transition from the ground singlet electronic state to the triplet electronic state because the electron spin is parallel to the spin in its ground state (Figure 1). This transition leads to a change in multiplicity and thus has a low probability of occurring which is a forbidden transition. Molecules also go through vibration relaxation to lose any excess vibrational energy that remains when excited to the electronic states (S1and S2) as demonstrated in orange in Figure 2. The knowledge of forbidden transition is used to explain and compare the peaks of absorption and emission.