2015-08-13
 630
630c. is unchanged.
d. may increase, decrease, or remain unchanged.
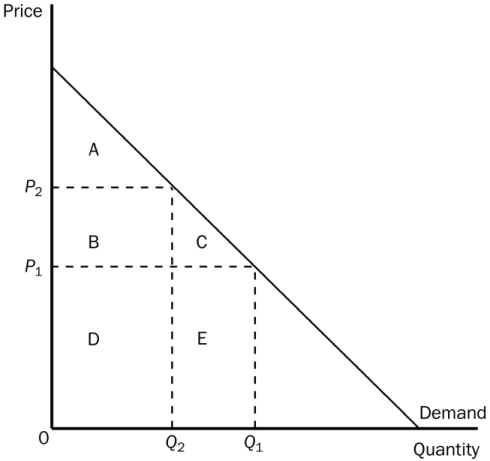
202. Refer to the graph shown. When the price is P1, consumer surplus is
a. A.
b. A + B.
c. A + B + C.
d. A + B + D.
203. Refer to the graph shown. At the higher price of P2, consumer surplus is
A. A.
b. B.
c. A + B.
d. A + B + C.
204. Refer to the graph shown. When the price rises from P1 to P2, consumer surplus
a. increases by an amount equal to A.
b. decreases by an amount equal to B + C.
c. increases by an amount equal to B + C.
d. decreases by an amount equal to C.
205. According to the graph shown, area C represents
a. the decrease in consumer surplus that results from a downward sloping demand curve.
B. consumer surplus to new consumers who enter the market when the price falls from P2 to P1.
c. an increase in producer surplus when quantity sold increases from Q2 to Q1.
d. a decrease in consumer surplus to each consumer in the market.
206. Refer to the graph shown. When the price rises from P1 to P2, which would NOT be true?
a. The buyers who still buy the good are worse off because they now pay more.
b. Some buyers leave the market because they are not willing to buy the good at the higher price.