2015-07-04
 255
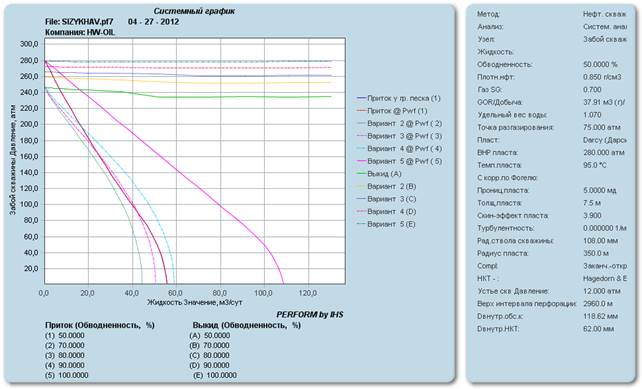
255By using “sensitivity analysis” function again well outputs were calculated for water cut values 70%, 80%, 90%, 100%:
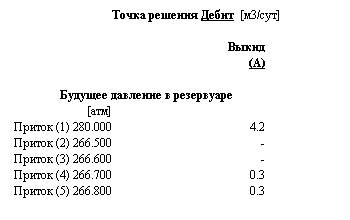
As graph shows, even with 100% water cut well still would be producing fluid. Additionally was calculated minimum reservoir pressure with water cut 80% (267,7 bar):
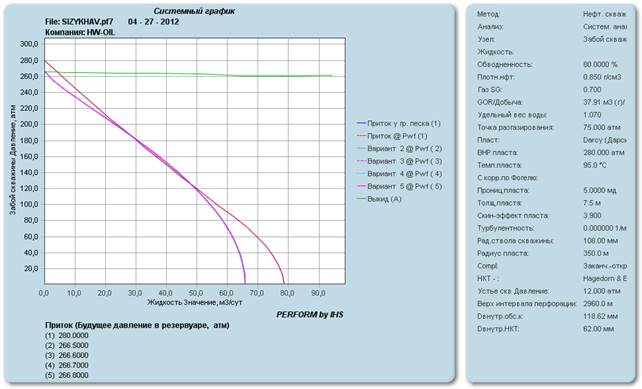 |
C. Well flow analysis with lower pressure and higher water cut
By lowering down pressure by 25% and raising water cut by 5%, well model stopped producing fluid:
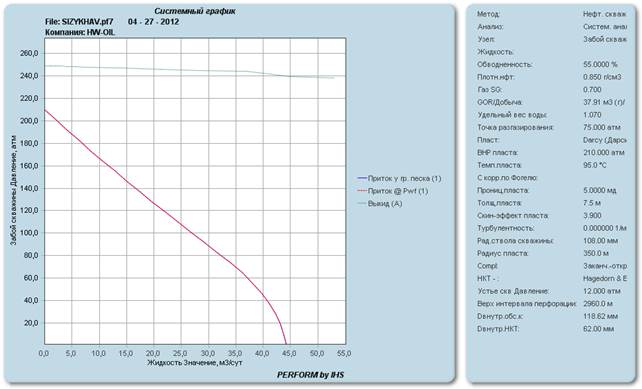
Hydraulic fracturing effect account
Hydraulic fracturing resulted in lowering down skin-factor (-4,5). By changing its values in model following results were gained:
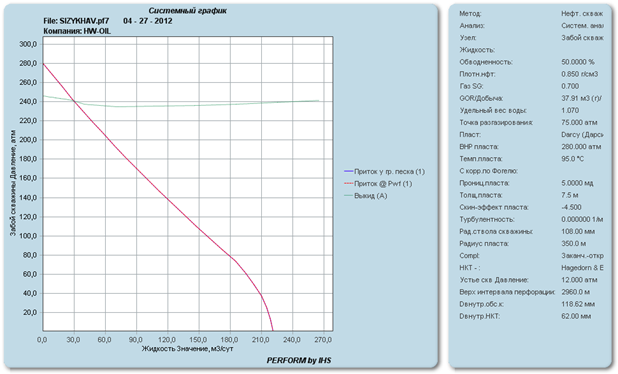 |
Well flow analysis after HF