2015-07-04
 362
362By using “sensitivity analysis”, minimum pressure was found as 247,4 bar:
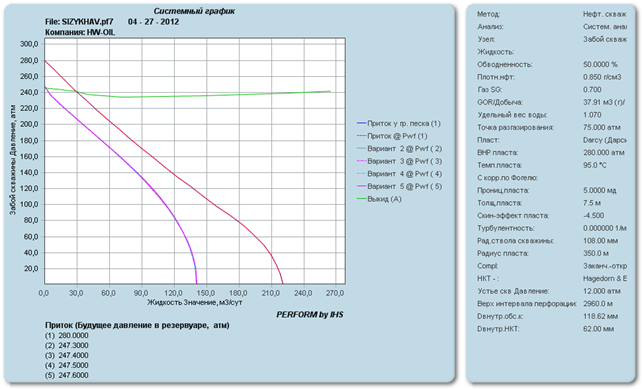
B. Maximum water cut with current pressure
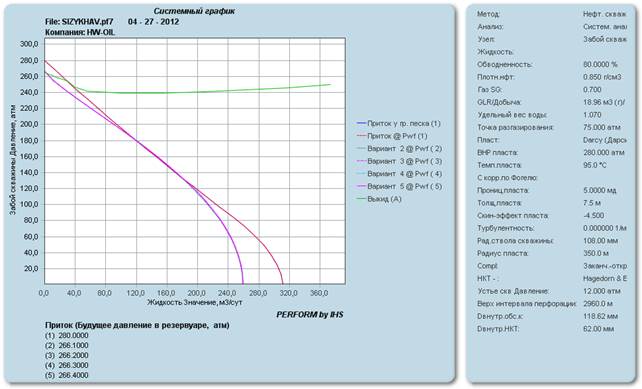
By using “sensitivity analysis” function again well outputs were calculated for water cut values 70%, 80%, 90%, 100%:
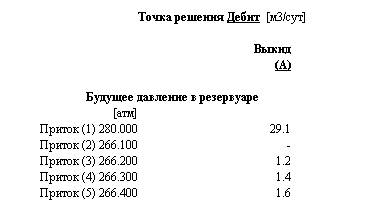
As graph shows, even with 100% water cut well still would be producing fluid. Additionally was calculated minimum reservoir pressure with water cut 80% (266,1 bar):
 |
 |
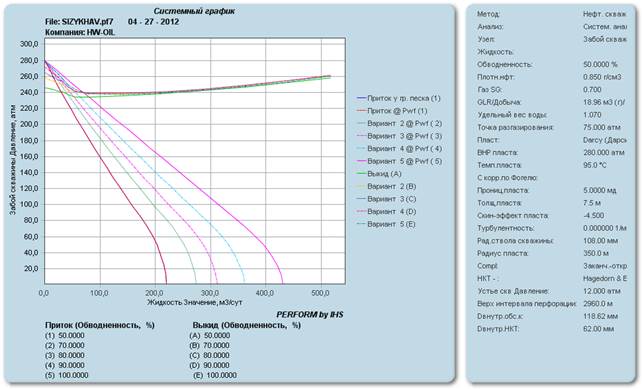
C. Well flow analysis with lower pressure and higher water cut
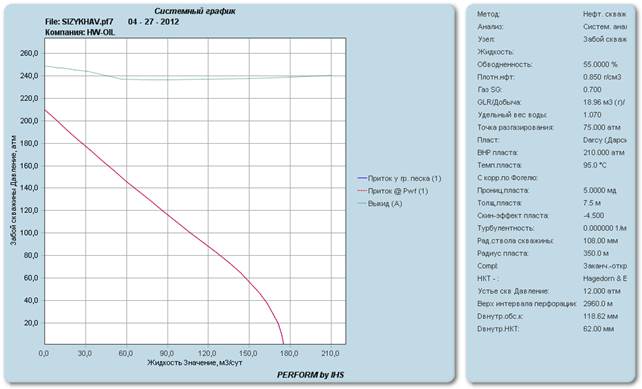
By lowering down pressure by 25% and raising water cut by 5%, well model stopped producing fluid:
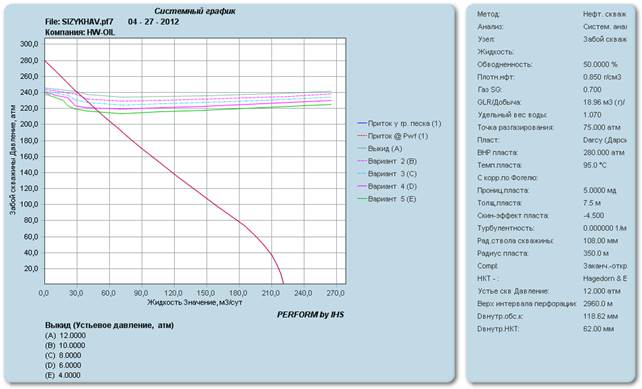
D. Collar pressure impact
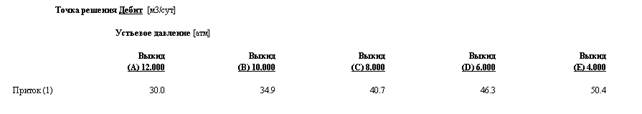
By changing collar pressure and comparing well output values next graph was formed: