2015-08-12
 517
517Task 1. Fill in the gaps in the given sentences.
| steady increase | stood at | rocketed | peaked | peaked | fell sharply |
| dropped | fell slightly | sudden increase | remained | rise sharply | reached |
1. In 1991, the price of gold _____________________at $380 an ounce.
2. From 1991 to 1993, the price of oil _____________________.
3. The price ________________________ stable at just under $400 an ounce between 1994 and 1996.
4. From 1997 to 2000, the price _____________________ from $380 to about $250.
4. There was a _______________________ in 2000 to about $300 an ounce.
5. From 2001 to 2006, there was a ____________________ in the price of gold.
6. The price __________________ in mid-2006 at $700 an ounce.
7. It continued to __________________ and ______________ again in mid-2008 at $1000 an ounce.
8. In 2009, the gold price ___________________ to about $700 an ounce.
9. From 2009 to the present, the price _____________________, until it _____________________ its current price of $1400 an ounce in early 2011.
Task 2. Changes in Milk Consumption
The graph shows changes in the amount of milk consumed per person per year in liters in the US between 1950 and 2000.
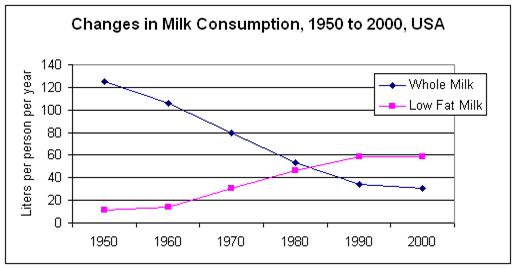
______. Overall, Americans drink much less milk now than at the start of the period. ______. It fell from about 130 liters per person in 1950 to only around 90 liters five decades later. ______. At the beginning, whole milk was more popular at 120 liters, but it fell sharply to about a quarter that by 2000. ______. It rose from roughly 10 liters in 1950 to five times that in 1980, when consumption was almost tied with whole milk. ______. In conclusion, the American diet with regard to dairy changes significantly over the time represented. ______.
Insert sentences 1-6 in the model essay:
1. The second major change was in the type of milk drunk.
2. The biggest change was the dramatic drop in total milk consumption.
3. Total consumption decreases but low-fat finally outranks whole milk.
4. In contrast, the amount of low fat milk consumed shot up.
5. By the end of the period, it was twice as popular as its counterpart.
6. The graph compares annual consumption of low fat and whole milk in liters per person in the second half of the 20th century in the USA.