2015-08-12
 754
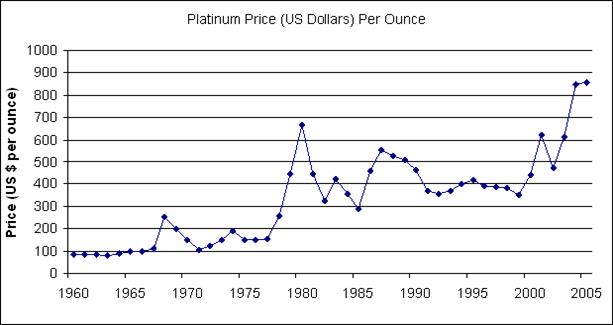
754Describe the line graph that shows the price of platinum per ounce in US dollars between 1960 and 2005
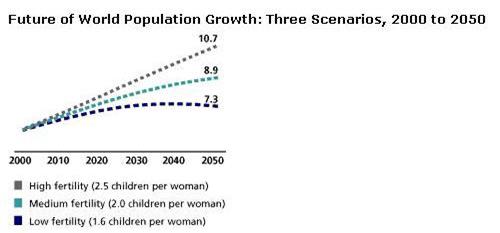
Task 4. Population growth in the future.
Write a short description of the chart.
What will happen to world population if we have the same number of children as now?
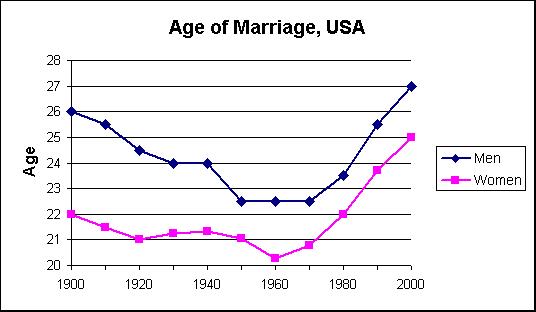
Task 5. Age of Marriage
Describe the graph that shows changes in the average age of marriage for men and women in the US in the last century.
Task 6.
Reading (Articles with statisctics)