2017-11-30
 448
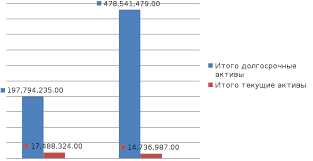
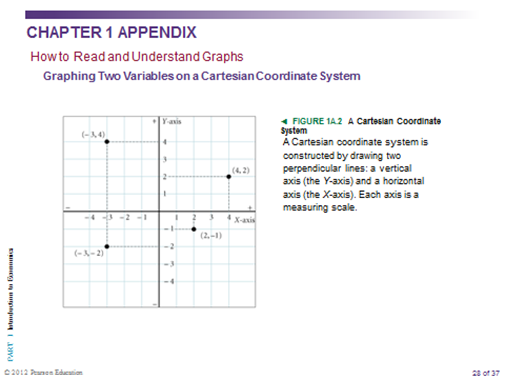
448A graph is a two-dimensional representation of a set of numbers, or data. A time series graph shows how a single measure or variable changes over time.


Conclusion
Economics is the study of how individuals and societies choose to use the scarce resources that nature and previous generations have provided. The key word in this definition is choose. Economics is a behavioral, or social, science. In large measure, it is the study of how people make choices. The choices that people make, when added up, translate into societal choices.
Control questions:
1. What does mean economics?
2. What kind of economic fields do you know?
3. What do you know about normative economics?
4. What kind of economic method do you know?
5. How to read and understand graphs?
Literature:
1. English for economists and managers: textbook/ O. V. Ulyanov, S. V. Grishin; yurginskiy technological Institute. – Tomsk: Publishing house of Tomsk Polytechnic University-theta, 2011. – 111 p.
2. Besanko D.A, Brauetugam R.R, Gibbs M.J Microeconomics,2011, Chicago
3. Griffiths A, Wall S.Economics for business and management,2011, England
4. Varian H.R. Intermediate microeconomics,2010, University of California at Berkeley
5. Boyd, W. Harper. Marketing Management.- Boston, 2010
Economic systems
The purpose: Resolve questions about economic system: the what, how, and for whom questions
Key words: economic systems, produced, market economy, centrally planned economy, mixed economy, traditional economy, market economy, production possibilities frontier, law of comparative advantage
Questions:
2.1 Economic Questions and Economic Systems
2.2 Production Possibilities Frontier
2.3 Comparative Advantage