2017-11-30
 280
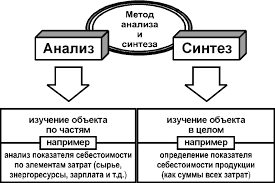
280• Ways that countries interact economically
– Trade (per CIA, 2013 est.)
• World exports: $18.71 trillion
(compare world GDP of $87 trillion)
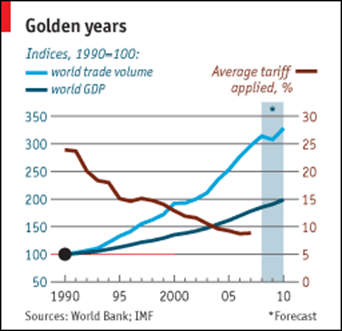
• World trade has grown faster than world GDP most years
– But not during 2008-9, due to world recession
• See tables below for
– Who trades most?
– Who trades with whom?
– Share of trade in GDP
– US:
• What do we export/import?
• To/from whom?
Who Trades the Most? ($ b. & % share, 2013)
| Exporters | Importers | ||||
| Value | Share | Value | Share | ||
| EU-28* | 15.3 | US | 15.4 | ||
| China | 14.7 | EU-28* | 14.8 | ||
| US | 10.5 | China | 12.9 | ||
| Japan | 4.8 | Japan | 5.5 | ||
| Korea, S. | 3.7 | Hng Kng | 4.1 | ||
| World | 100.0 | World | 100.0 |
Source: WTO, International Trade Statistics, 2014, Table I.8
Who Trades the Most?
• Developed countries are the biggest traders
• China is catching up, in trade volume
– It was the #3 exporter six years ago when I taught the course; now it’s #2 and closing in on EU.
– Others are gaining as well: Four years ago Canada was #5 exporter. Three years ago that was S Korea
• See Economist from about a year ago: “Trading Up: Picking the world champion of trade”
– China claimed to have surpassed US. True only for goods, not goods + services
• But with time China will pass US in both
– China’s trade per GDP is much larger than the US, but below world average
– Much of the value in China’s exports is imported inputs, thus low “value added.”
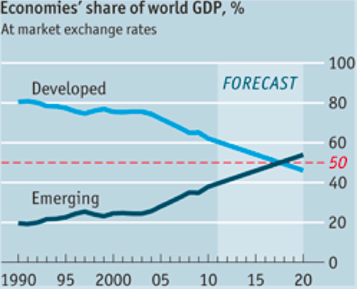
• “Emerging Markets” in general are catching up to, or surpassing, the developed countries
– In GDP, trade, and more
– See Economics Focus from The Economist, “Why the Tail Wags the Dog”
What Does the World Trade? ($ b. 2013 & annual % growth rates, merchandise exports)
| Value | 00-05 | 05-13 | ||||||
| All Products | 17,590 | |||||||
| Agriculture | 1,745 | –12 | ||||||
| Fuel&Mining | 3,997 | –36 | –3 | |||||
| Manuf. | 11,848 | –20 |
Source: WTO, International Trade Statistics, 2014, Table II.1