2020-06-29
 446
446When you talk about demand what comes to mind first is markets. A market is a platform which brings together buyers of different sorts and sellers of different sorts. They are the demanders and the suppliers in any situation that involves a potential exchange of goods and cash.
The corner gas-station, an e-commerce site, the local music store, a farmer’s road-side stand – these are all markets familiar to us all.
Now, let’s go on to examine what demand is. Demand is a schedule or curve that shows the quantity of a products that are purchased at various possible prices, other things equal. It shows you the pattern the consumer follows when he is willing and able to purchase various amounts of a product at each of a series of possible prices during specified period of time.
Let’s consider this hypothetical demand schedule for a single consumer purchasing bushels of corn. This table shows how various prices of corn and quantity of corn a particular consumer will be willing and able to purchase at each of these prices are related. At $5 per bushel the consumer is willing and able to buy 10 bushels per week. But at $4 the consumer is willing and able to buy as many as 20 bushels per week, and so forth. Thus, demand is simply the statement of a buyer’s intentions with respect to the purchase of a product.
Let’s represent the relationship between the prices of corn and an individual demand for this corn on a simple graph. Let’s measure quantity demanded on a horizontal axis and price on a vertical axis. Let’s plot and connect five price-quantity data points listed in the table with a smooth curve labeled D. This curve is what we call a demand curve. It’s downward slope reflecting an inverse relationship that economists call the Law of Demand. So, what we understand is, the other things equal, consumers will buy more of a product as its price declines and less of it as its price rises.
Having come to this conclusion, we must ask ourselves another question: Why is there inverse relationship between price and quantity demanded? Actually, the law of demand is consistent with common sense. People do tend to buy more when its price is low rather than when its price is high. Thus there is always a rush at clearance sales. It’s an ample evidence of the law of demand.
Buying depends on one more thing. And that’s utility. It’s been noted that in any specific time period a buyer derives less satisfaction of each successive unit of the product he consumes. This satisfaction can be termed marginal utility. Because each successive unit yields less and less marginal utility he will buy additional units only if the price of these units are progressively reduced. We see therefore that consumption is subject to diminishing marginal utility.
For example, a declined price of a chicken will increase a purchasing power of consumers’ incomes enabling people buying more chicken. This is the income effect: the price declined and heaves the demand.
At a low price chicken is relatively more attractive and the consumers tend to substitute it for pork, lamb, beef and fish. This is the substitution effect that price declined and heaves the demand.
Income and substitution effects combine to make consumers willing and able to buy more of a product at a lower price than at a high price. It thus becomes clear how price and quantity demanded are inversely related.
Unit 6: The Law of Supply
The law of supply is one of the fundamental principles in microeconomics. According to the law of supply, for all other things remaining constant, the higher the price of a good or service, the higher the supply.
Producers want to produce more of goods and services at a higher price to increase profits. Conversely, the lower the price, the lower the supply.
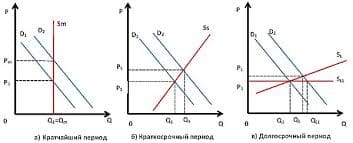
If you would graph this relationship with the quantity supplied on a X-axis and the price on a Y-axis, the relationship between price and supply is graphed as an upward sloping curve from left to right. This line is referred to as a supply curve. Movement along the supply curve is referred to as supply expanding or contracting as price changes.
Weslia Corp. produces electric cars. At a price of $20,000, Weslia produces 5,000 cars. If the price increases to $25,000, Weslia will produce 6,000 electric cars. The higher price induces them to build more cars.
The law of supply is a theoretical concept. In real life variables do not remain constant. Things other than price can affect supply, such as prices of related goods, availability and price of raw materials.
Assume Weslia has built a new more efficient factory. It is now able to produce 6,000 electric cars at the $20,000 price. The supply curve shifts down and to the right. The quantity supplied changed because of an external factor instead of a change in price.