2015-08-21
 418
418Two similar centrifugal pumps 3 (Fig.6.) (their characteristics are given below in tables 6,7) are simultaneously supplying the fuel to tanks 6 and 7. Pipelines branching from the pumps are connected in A knot. The pressure at A knot is P. Pipeline bifurcation is accomplished in B knot. 6 and 7 tanks filling is finished simultaneously.
Determine:
1.Delivery, pressure head and consumed power for each of the pumps.
2.Diameters d3 and d4 of the pipelines connected to 6 and 7 fuel tanks.
Note: The fuel level alteration in the tanks is ignored.
Solution technique:
1. Draw characteristics of both pumps using the table data.
2. Set-up characteristic equation for each of the pipelines up to knot A and sketch-graphs having combined them with the respective pump characteristics.
3. Draw pressure versus flow rate curve in knot A separately for each of the pipelines and compose summary pressure – flow rate characteristic in the knot A.
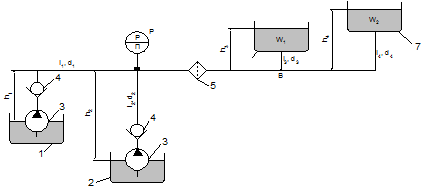 Fig.6. Schematic diagram of the emergency fuel drain: 1,2,6,7 – fuel tanks; 3 – centrifugal pump; 4 – non-return valve; 5 – filter
4. Determine the total flow rate in the knot A and delivery at each of the pumps.
5. Calculate the pressure head and consumed power for each of the pumps.
6. Determine fuel flow in the pipelines connected to 6 and 7 tanks.
7. Set-up characteristic equations for the pointed pipelines and draw pressure versus diameter curve for each of the pipelines from point B to the vessels.
8. Determine pipelines diameters d3 and d4, using available pressure at point B.
Table 6
| Data | Variant | |||||||||
| l1, m | 0,6 | 1,0 | 1,4 | 1,8 | 2,2 | 2,6 | 3,0 | 3,4 | 3,8 | 4,2 |
| D1, m | 0,020 | 0,022 | 0,034 | 0,025 | 0,028 | 0,030 | 0,032 | 0,035 | 0,038 | 0,040 |
| L2, m | ||||||||||
| D2, m | 0,040 | 0,042 | 0,045 | 0,048 | 0,050 | 0,055 | 0,060 | 0,065 | 0,070 | 0,075 |
| P, kPa | ||||||||||
| L3, m | 0,5 | 0,6 | 0,7 | 0,8 | 0,9 | 1,0 | 1,1 | 1,2 | 1,3 | 1,4 |
| L4, m | 3,5 | 4,0 | 4,5 | 5,6 | 5,8 | 6,0 | 6,5 | 7,0 | 7,5 | 8,0 |
| H1, m | 0,3 | 0,7 | 1,1 | 1,5 | 1,9 | 2,3 | 2,7 | 3,1 | 3,5 | 3,0 |
| H2, m | 3,3 | 3,7 | 4,1 | 4,5 | 4,9 | 5,3 | 5,7 | 6,1 | 6,5 | 6,9 |
| h 3, m | 0,7 | 0,8 | 0,9 | 1,0 | 1,1 | 1,2 | 1,3 | 1,4 | 1,5 | 1,6 |
| H4, m | 2,5 | 3,0 | 3,5 | 4,0 | 4,5 | 5,0 | 5,5 | 6,0 | 6,5 | |
| W1, m3 | 5,5 | |||||||||
| W2, m3 |
Table 7
| Data | |||||||||
| Qp, m3/s | 0,0004 | 0,0008 | 0,0012 | 0,0014 | 0,0016 | 0,0018 | 0,002 | 0,0022 | |
| Hp, m | |||||||||
| η % |
ASSIGNMENT 7
Emergency fuel drain is accomplished (Fig.7.) in case of emergency aircraft landing. The principle scheme of the emergency drain system is shown on the lay-out. Kerosene is supplied to the drain pipeline by two groups of pumps, installed in the 1st and 2d fuel tanks. Kerosene viscosity is ν. The volume of drained fuel is W. The pipeline diameter is d. The lengths of the pipes are l1 and l2. Pipelines local resistance coefficients are ζ1 and ζ2, number of the pumps in the tanks are z1 and z2. Pump efficiency is η.
Basic calculation data are given in table 8.
There are additional data for estimating the H = f (Q) characteristic for centrifugal pump in tables 9.
Determine:
1. Emergency fuel drain duration.
| Q, l/s | 0,1 | 0,2 | 0,3 | 0,4 | 0,5 | 0,6 | |
| H, m | 18,0 | 17,0 | 15,5 | 13,8 | 11,4 | 8,2 | 3,0 |
2. Volume of fuel drain from tank 2.
3. Total power of the pumps.
4. Emergency fuel drain duration in the case of 50% pumps failure.
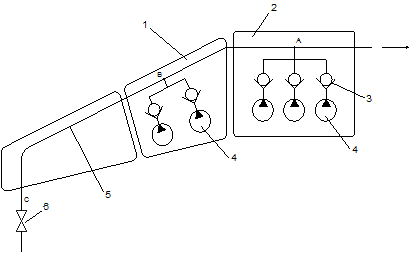
Fig.7. Schematic diagram of the emergency fuel drain: 1, 2 – tanks; 3 – non- return valve; 4 – pumps; 5 – drain pipelines; 6 – tap
Note: The calculus should be performed on graphic and analytic method only for one drain pipeline branch.
Solution technique:
1. Plot up the pumps characteristics, according to table 9 and taking into consideration their parallel operation for two pipelines simultaneously. Subtract the value of pressure loss in pipeline 2 from point A to B from curve 1 to receive curve 2.
2. Fined the pressure flow rate characteristic for point B summing estimated characteristics.
3. Plot the drain pipeline characteristic from point B to C.
Table 8
| Data | Variant | |||||||||
| ν,m2 /s | 5*10-6 | 4*10-6 | 3*10-6 | 1*10-6 | 2*10-6 | 1*10-6 | 3*10-6 | 4*10-6 | 6*10-6 | 5*10-6 |
| W, m3 | ||||||||||
| d, m | 0,10 | 0,08 | 0,09 | 0,08 | 0,08 | 0,08 | 0,09 | 0,08 | 0,085 | 0,08 |
| l1, m | ||||||||||
| l2, m | ||||||||||
| ζ1 | ||||||||||
| ζ2 | ||||||||||
| z1 | ||||||||||
| z2 | ||||||||||
| η | 0,56 | 0,62 | 0,70 |
Table 9
| Q, l/s | 0,1 | 0,2 | 0,3 | 0,4 | 0,5 | 0,6 | |
| H, m | 18,0 | 17,0 | 15,5 | 13,8 | 11,4 | 8,2 | 3,0 |
ASSIGNMENT 8
The aircraft engines (Fig.8.) are fed with kerosene by two centrifugal pumps 10 installed in service tanks 3 and 7 of the fuel system. The kerosene transferring is dosed by D1 and D2 throttles from tanks 1 and 8, emergency kerosene drains from tank 8 along pipeline 9 through the left and right detaching part of the wing. Kerosene viscosity is v, the volume of drained fuel is W, and emergency drain pipeline diameter and length are d3 and l3 respectively. Total head losses coefficient of drain pipeline is ζ3. D1 and D2 are the throttles dosing the fuel under transferring. Q1 and Q2 are throttle D1 and D2 fuel discharge. Quantity of pumps equals z3 and z4. Calculation data are given in table 10.
There are additional data in table 2 which is necessary for plotting pump characteristic.
Determine:
1. Emergency fuel drain duration.
2. Cross section area of throttles feeding the fuel to tanks 1 and 2.
3. Total pumps power.
4. Fuel drain duration in case of 50% pumps failure.
Note: The calculi are carried out by graphic and analytic methods in complex.
Solution technique:
1. Plot the pump characteristic.
2. Plot the drain pipeline characteristic and find the stationary points on the graphs.
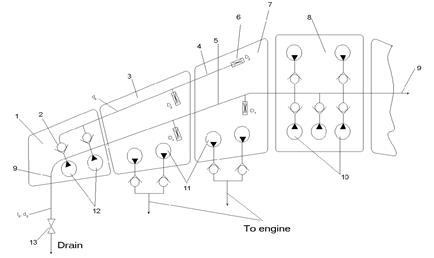
Fig.8. Schematic diagram of the engine fuel supply: 1 – tank; 2 – non-return valve; 3 – tank; 4 – feeding pipeline; 5 – throttle D1; 6 – throttle D2; 7 – tank; 8 – tank; 9 – emergency fuel drain pipeline; 10,12 – transferring pumps; 11 – feeding pumps; 13 – stopcock
3. Estimate the fuel emergency drain time.
4. Plot the pump characteristic for tank 5.
5. Find the necessary pressure for kerosene to escape from the throttles.
6. According to the estimated pressure find the throttles diameters D1 and D2.
Notes: 1. Head losses in pipes 3 and 8 should be ignored because of their insignificance in comparison with the throttles losses.
2. The explanation given for assignment 7 should be used while plotting the hydraulic characteristics.
Table 10
| Data | Variant | |||||||||
| ν,m2 /s | 5*10-6 | 3*10-6 | 4*10-6 | 2*10-6 | 1*10-6 | 5*10-6 | 3*10-6 | 4*10-6 | 2*10-6 | 1*10-6 |
| W, m3 | ||||||||||
| Q1, m3/h | 0,4 | 0,3 | 0,4 | 0,5 | 0,4 | 0,3 | 0,4 | 0,5 | 0,3 | 0,4 |
| Q2, m3/h | 1,2 | 1,4 | 1,5 | 1,0 | 1,6 | 1,2 | 1,4 | 1,5 | 1,6 | 1,7 |
| l3, m | ||||||||||
| ζ3 | ||||||||||
| d3, mm | ||||||||||
| z6 | ||||||||||
| z5 | ||||||||||
| η | 0,65 | 0,55 | 0,58 |
Table 11
| Q, l/s | 0,001 | 0,002 | 0,003 | 0,004 | 0,005 | 0,006 | |
| H, m | 18,0 | 17,0 | 15,5 | 13,8 | 11,4 | 8,2 | 3,0 |
ASSIGNMENT 9
Gear pump (Fig.9.) supplies АМG-10 oil into hydrocylinder 7, which is loaded by external force R. The area of the piston is F. Some liquid returns into the service tank along the pipeline l1, d1, through the throttle with coefficient of resistance ζ4. Oil, running into the cylinder through the pipeline l2, d2 and leaving it through the pipeline l3, d3 passes two-time control valve 6. Resistance coefficient is equal to ζ2 in both cases. Piston flow velocity is V.
Calculation data are given in table 12.
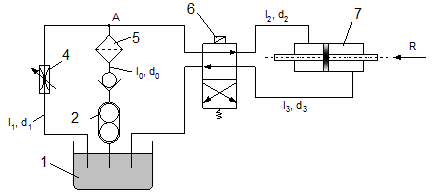 Fig.9. Schematic diagram of the hydraulic system: 1 – tank; 2 – pump; 3 – non-return valve; 4 – throttle; 5 – strainer; 6 – flow control valve; 7 – cylinder
Determine:
1. The pump pressure and its power consumption, if the pump efficiency is η.
2. Resistance coefficient ζ4 throttle 4.
3. Piston velocity and pump pressure in the case the bypass pipe is closed.
Note: Take d2 = d3 during the calculation.
Solution technique:
1. Find the liquid discharge into the cylinder and necessary pressure to move piston against the load.
2. Estimate the pressure at point A.
3. Calculate the pump pressure and the power consumption of the driver.
4. Estimate liquid flow rate through the bypass pipeline and resistance coefficient of the throttle.
| Data | Variant | |||||||||
| Q, m /s3 | 0,0020 | 0,0019 | 0,0018 | 0,0011 | 0,0016 | 0,0015 | 0,0014 | 0,0013 | 0,0012 | 0,0011 |
| l0, m | 4,0 | 2,5 | 3,0 | 3,5 | 4,0 | 4,5 | 5,0 | 5,5 | 6,0 | 6,5 |
| D0, m | 0,060 | 0,055 | 0,055 | 0,048 | 0,045 | 0,042 | 0,040 | 0,038 | 0,035 | 0,032 |
| l1, m | 3,0 | 3,5 | 4,0 | 4,5 | 5,0 | 5,5 | 6,0 | 6,5 | 7,0 | 7,5 |
| d1, m | 0,038 | 0,035 | 0,032 | 0,030 | 0,028 | 0,025 | 0,024 | 0,022 | 0,020 | 0,018 |
| l2, m | ||||||||||
| d2, m | 0,040 | 0,038 | 0,035 | 0,032 | 0,030 | 0,028 | 0,025 | 0,024 | 0,022 | 0,020 |
| l3, m | ||||||||||
| ζ2 | ||||||||||
| V, m/s | 0,065 | 0,060 | 0,055 | 0,050 | 0,045 | 00,40 | 0,035 | 0,030 | 0,025 | 0,020 |
| F, m2 | 0,019 | 0,018 | 0,017 | 0,016 | 0,015 | 0,014 | 0,013 | 0,012 | 0,011 | 0,010 |
| η | 0,95 | 0,94 | 0,93 | 0,92 | 0,91 | 0,90 | 0,89 | 0,88 | 0,87 | 0,86 |
| R, kN | 1,1 | 1,2 | 1,4 | 1,6 | 1,8 | 2,0 | 2,2 | 2,4 | 2,6 | 2,8 |
Table 12
| Data | Variant | |||||||||
| Q, m /s3 | 0,0020 | 0,0019 | 0,0018 | 0,0011 | 0,0016 | 0,0015 | 0,0014 | 0,0013 | 0,0012 | 0,0011 |
| l0, m | 4,0 | 2,5 | 3,0 | 3,5 | 4,0 | 4,5 | 5,0 | 5,5 | 6,0 | 6,5 |
| D0, m | 0,060 | 0,055 | 0,055 | 0,048 | 0,045 | 0,042 | 0,040 | 0,038 | 0,035 | 0,032 |
| l1, m | 3,0 | 3,5 | 4,0 | 4,5 | 5,0 | 5,5 | 6,0 | 6,5 | 7,0 | 7,5 |
| d1, m | 0,038 | 0,035 | 0,032 | 0,030 | 0,028 | 0,025 | 0,024 | 0,022 | 0,020 | 0,018 |
| l2, m | ||||||||||
| d2, m | 0,040 | 0,038 | 0,035 | 0,032 | 0,030 | 0,028 | 0,025 | 0,024 | 0,022 | 0,020 |
| l3, m | ||||||||||
| ζ2 | ||||||||||
| V, m/s | 0,065 | 0,060 | 0,055 | 0,050 | 0,045 | 00,40 | 0,035 | 0,030 | 0,025 | 0,020 |
| F, m2 | 0,019 | 0,018 | 0,017 | 0,016 | 0,015 | 0,014 | 0,013 | 0,012 | 0,011 | 0,010 |
| Η | 0,95 | 0,94 | 0,93 | 0,92 | 0,91 | 0,90 | 0,89 | 0,88 | 0,87 | 0,86 |
| R, kN | 1,1 | 1,2 | 1,4 | 1,6 | 1,8 | 2,0 | 2,2 | 2,4 | 2,6 | 2,8 |
ASSIGNMENT 10
Pump 8 (Fig.10.) supplies liquid to the cylinders, loaded by forces R1 and R2, through the non-return valve 7 and filter 6.
Calculation data are given in the table 13.
Determine:
1. Pump entrance (point A) and pump exit (point B) pressure.
2. Local resistance coefficients for throttles ζ2 and ζ3, if moving velocities of both pistons are equal.
3. Draw hydraulic gradient for CK and EK sectors.
Note: Local resistance coefficients indexes correspond with local resistance number in Fig.10.
Liquid head in the tanks may be ignored.
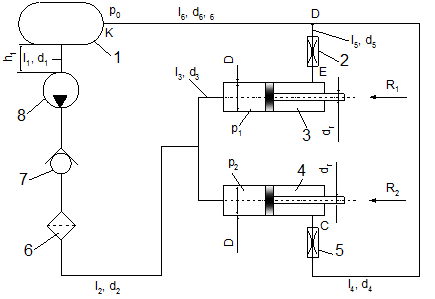 Fig.10. Schematic diagram for hydraulic drive: 1 – service tank;
2, 5 – throttles; 3, 4 – cylinders; 6 – filter; 7 – non-return valve; 8 – pump
Solution technique:
1. Obtain piston velocity and liquid in the drain pipeline.
2. Calculate the pressure at points A, B, D (it is necessary to consider roughness Δ6 pipeline 6).
3. Estimate cylinders drain pressure p3 and p4.
4. Find local resistance coefficients ζ2 and ζ5.
5. Plot hydraulic gradients.
Table 13
| Data | Variant | |||||||||||||||
| P0, kPa | ||||||||||||||||
| P1=P2, MPa | 16,5 | 14,5 | 12,5 | 12,5 | 13,5 | |||||||||||
| Q,m3/s | 8,0*10-4 | 8,2*10-4 | 8,4*10-4 | 8,5*10-4 | 8,0*10-4 | 7,8*10-4 | 8,2*10-4 | 8,3*10-4 | 8,4*10-4 | 8,5*10-4 | ||||||
| R1,N | 2,0*104 | 2,2*104 | 2,3*104 | 2,0*104 | 2,1*104 | 2,2*104 | 2,0*104 | 2,5*104 | 2,2*104 | 2,3*104 | ||||||
| R2,N | 2,5*104 | 2,1*104 | 2,8*104 | 2,6*104 | 2,7*104 | 2,8*104 | 2,3*104 | 2,2*104 | 2,2*104 | 2,1*104 | ||||||
| l1,m | 3,0 | 4,0 | 5,5 | 5,5 | 4,5 | 4,0 | 3,5 | 3,0 | 3,5 | 4,0 | ||||||
| l1,m | 3,0 | 4,5 | 6,5 | 6,3 | 5,2 | 5,0 | 4,0 | 4,0 | 4,0 | 4,6 | ||||||
| l 2, m | 4,0 | 5,0 | 6,0 | 6,0 | 8,0 | 7,5 | 6,5 | 5,5 | 6,0 | 7,0 | ||||||
| l 3, m | 2,0 | 2,5 | 3,0 | 3,5 | 4,0 | 4,5 | 4,0 | 5,0 | 6,0 | 6,5 | ||||||
| l4, m | 5,0 | 6,0 | 7,0 | 8,0 | 9,0 | 9,5 | 10,0 | 10,5 | 10,0 | 8,5 | ||||||
| l5, m | 4,0 | 4,5 | 4,2 | 4,4 | 5,0 | 6,0 | 4,5 | 7,0 | 7,0 | 6,0 | ||||||
| l6,m | ||||||||||||||||
| d1,m | 0,040 | 0,040 | 0,040 | 0,042 | 0,044 | 0,044 | 0,042 | 0,042 | 0,040 | 0,040 | ||||||
| d2,m | 0,012 | 0,012 | 0,012 | 0,014 | 0,014 | 0,014 | 0,014 | 0,016 | 0,016 | 0,016 | ||||||
| d3,m | 0,008 | 0,008 | 0,008 | 0,008 | 0,010 | 0,010 | 0,010 | 0,010 | 0,012 | 0,012 | ||||||
| d4,m | 0,012 | 0,012 | 0,012 | 0,010 | 0,008 | 0,008 | 0,008 | 0,010 | 0,010 | 0,010 | ||||||
| d5,m | 0,010 | 0,010 | 0,010 | 0,008 | 0,008 | 0,008 | 0,010 | 0,008 | 0,008 | 0,010 | ||||||
| d6,m | 0,018 | 0,018 | 0,014 | 0,014 | 0,012 | 0,012 | 0,016 | 0,012 | 0,016 | 0,018 | ||||||
| Δ6,mm | 0,14 | 0,14 | 0,14 | 0,14 | 0,12 | 0,12 | 0,13 | 0,13 | 0,12 | 0,12 | ||||||
| D, m | 0,060 | 0,062 | 0,058 | 0,060 | 0,060 | 0,058 | 0,058 | 0,062 | 0,062 | 0,062 | ||||||
| dr, m | 0,038 | 0,038 | 0,038 | 0,040 | 0,040 | 0,040 | 0,042 | 0,042 | 0,042 | 0,042 | ||||||
| ν•10-6 m2/s | 1,2*10-5 | 1,2*10-5 | 1,2*10-5 | 1,4*10-5 | 1,4*10-5 | 1,1*10-5 | 1,1*10-5 | 1,3*10-5 | 1,0*10-5 | 1,0*10-5 | ||||||
| ρ,kg/ m3 | ||||||||||||||||